Launch your presentation in runtime to navigate through the slides, and dynamically interact with the presentation's content.
To launch the presentation in runtime:
- Click the Pyramid runtime button to run the presentation from the current slide
- Click From Beginning in the Home ribbon to run the presentation from the first slide
- From the Content Explorer click on the presentation, or open its context menu and click View
- Open the presentation's URL link to launch it in runtime mode
Runtime Functions and Interactive Capabilities
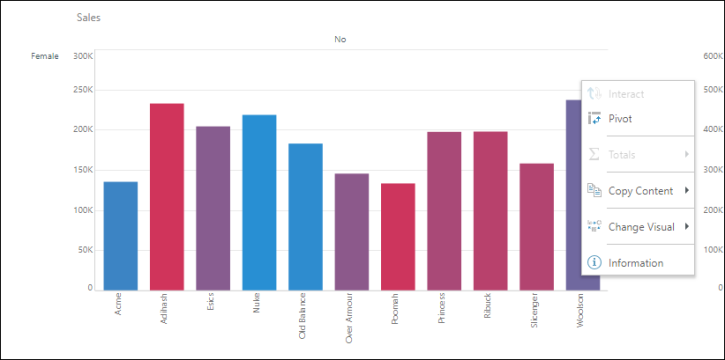
From runtime, the right click context menus expose a variety of interactive functions that let you perform further analysis of your data on the fly.
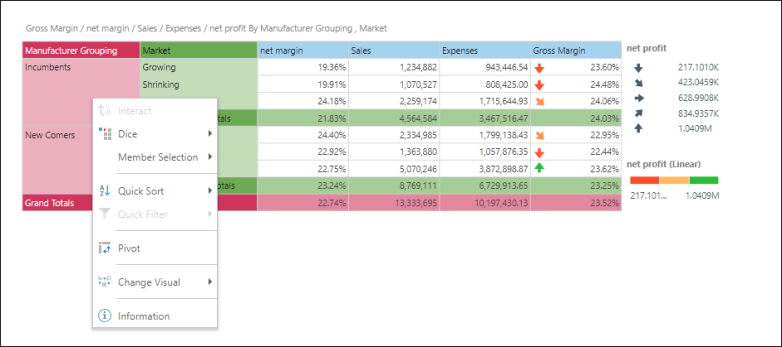
Select the required functions from the context menu:
|
Function |
Details |
|---|---|
|
Actions |
Reveal actions built in Present. |
|
Build New Alert |
Build a new alert for the given data point. This option is only enabled once the presentation has been saved. |
|
Change Visual |
Change the visual to visualize the data in a different way. To learn about the different types of visualizations available, click here. |
|
Copy a visual's raw data, which can then be pasted in Excel. Right click on the visual's background to view this option. There is a limit of 400,000 cells. |
|
|
Dice |
Dice a member by another hierarchy. |
|
Drill functions |
When working with visuals containing user hierarchies, right click on a member to drill down, drill up, or drill to a specific level. When working with charts, access these functions by right clicking on the members listed in the chart's legend. |
|
Expand Down and Collapse |
If the visual contains a user hierarchy, right click on the member rows to expand down to the next level. To collapse a level, right click on its parent level and select Collapse. When working with charts, access these functions by right clicking on the members listed in the chart's legend. |
|
Focus or Eliminate Data Point |
Focus or eliminate a data point, or a member. Right click on the relevant data point (for grids, this will be a cell). |
|
Selected Members/ Member Selection |
Select the relevant member, and then dice it by another hierarchy, or focus or eliminate it. |
|
Start New Conversation |
Click this button to start a new conversation. |
|
Show Conversations |
Show existing conversations. |
|
Information |
View a summary of the selected visual, including its filters (the measures it contains), statistics (the number of columns, rows, and cells it contains), and its metadata. |
|
Interact |
Where a data interaction has been configured, in order to cross filter visualizations, the Interact button will be enabled. |
|
Pivot |
Use the pivot function to switch the axes. For charts, right click on the chart background, or the chart legend. For grids, right click on the members, or on the measure header. |
|
Quick Filter |
When working with grids, right click on a measure header to quick filter by the top or bottom count or percent. |
|
Quick Sort |
When working with grids, right click on a measure header to quick sort according to values or labels. |
|
Totals |
When working with grids, right click on an element header to access the Totals functions. |